Key Performance Indicators (KPIs) can be applied to charts and scatter plots in Analytics. Using KPIs enables you to easily visualize whether installation parts are functioning properly, quickly identify performance deviations and take corrective measures. A KPI indicates the extent to which values lie within the margins you have set.
Example:
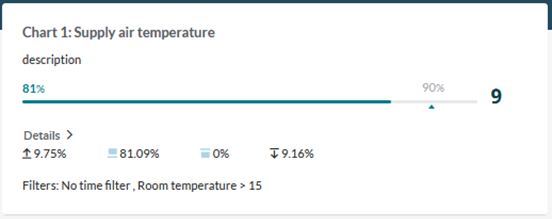
Below is a KPI for a chart of the supply air temperature. 81% of the values are inside the set bandwidth. Because the target percentage is set to 90%, this results in a KPI grade of 9 for the supply air temperature. Click on ‘Details’ to show the chart.
KPIs can be combined into KPI sets.
Read here how to: