Set KPIs using a bandwidth and a KPI target.
- Bandwidth: Define how much the actual values may deviate from the coordinates > blue bandwidth in the scatter plot.
- KPI: Set a target percentage. If this percentage of values is within the set bandwidth, then the KPI grade becomes 10.
Example:
Below is a chart with KPI for the supply air temperature. 81% of the values are inside the set bandwidth. Because the target percentage is set to 90%, this results in a KPI grade of 9 for the supply air temperature.
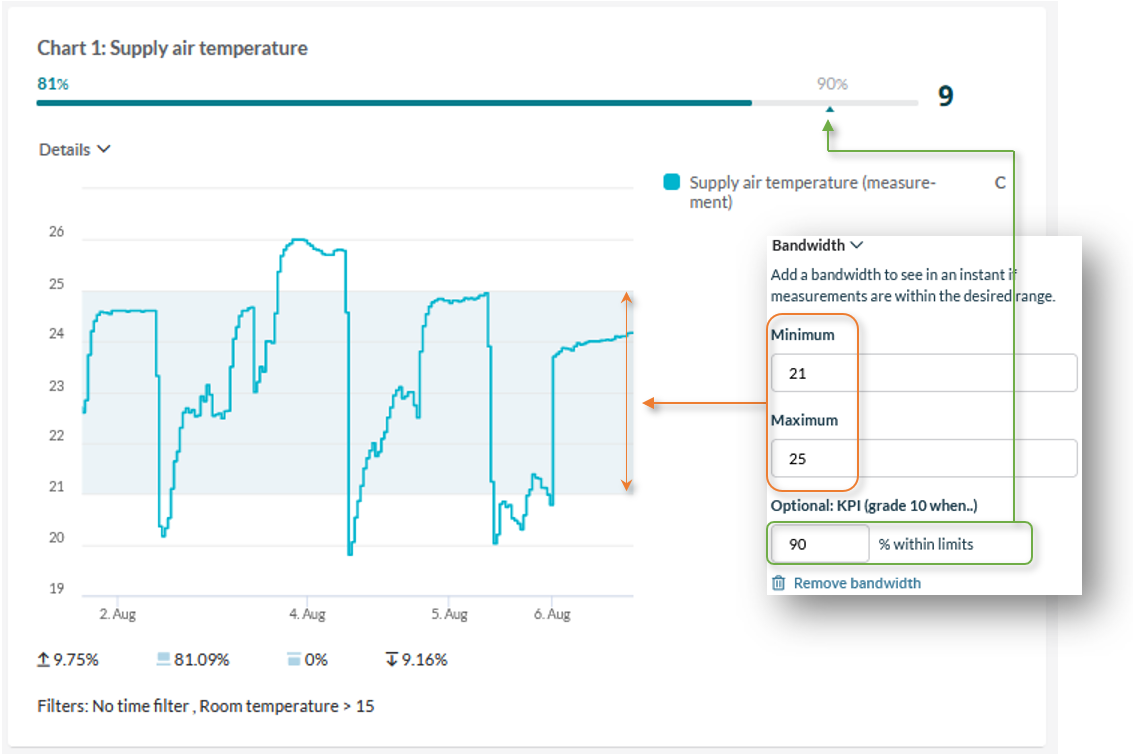
By setting filters, irrelevant measurements can be excluded in the calculation of the KPI grade. There are two filter types: a time filter (in operation / not in operation) and a data point filter. The data point filter allows you to add a condition for a chosen data point. For example: only calculate the KPI and show values in the chart for data point 'room temperature' greater than 15 °C.